
Deploying and managing your Virtual Machines has never been easier, thanks to Microsoft’s Azure Services. But how many times in a day does your support person have to switch between tabs to monitor the performance of your Azure Resources? Thanks to Azure Monitor service, you can create alerts in order to be notified when something goes wrong. Before going deeper, let’s see what is Azure Monitor?
Microsoft has introduced in March 2017 a new service called Azure Monitor. Azure Monitor is the Microsoft’s built-in platform monitoring service for Azure. Azure Monitor provides you all the needed monitoring telemetry in order to monitor your environment. Azure Monitor can be used with great tools such as:
- REST APIs
- ARM Templates
- PowerShell cmdlets
- Azure CLI support
It means that you can easily configure your Azure monitoring metrics and also automate all the manual tasks. Let’s take a look at the Azure Monitor console.
Azure Monitor
As Azure continues to grow, it is really important to keep informed. Here is an important feature that lets you monitor your Azure Resources. Azure Monitor includes some great services such as:

- Alerts: Alerts provide notifications for key metrics on your Azure resources
- Activity Log: This section provides a history of subscription-level events in Azure
- Metrics: Metrics are also called performance counters. Metrics will help you to check the performance and health of your workloads on Azure
- Application Insights: It is an extensible Application Performance Management (APM) service for web developers building and managing apps on multiple platforms
- Azure Health Service: It provides the ability to see service issues, planned maintenances, and health advisories
Azure Monitor comes with a default dashboard which is an overview of alerts and service issues:
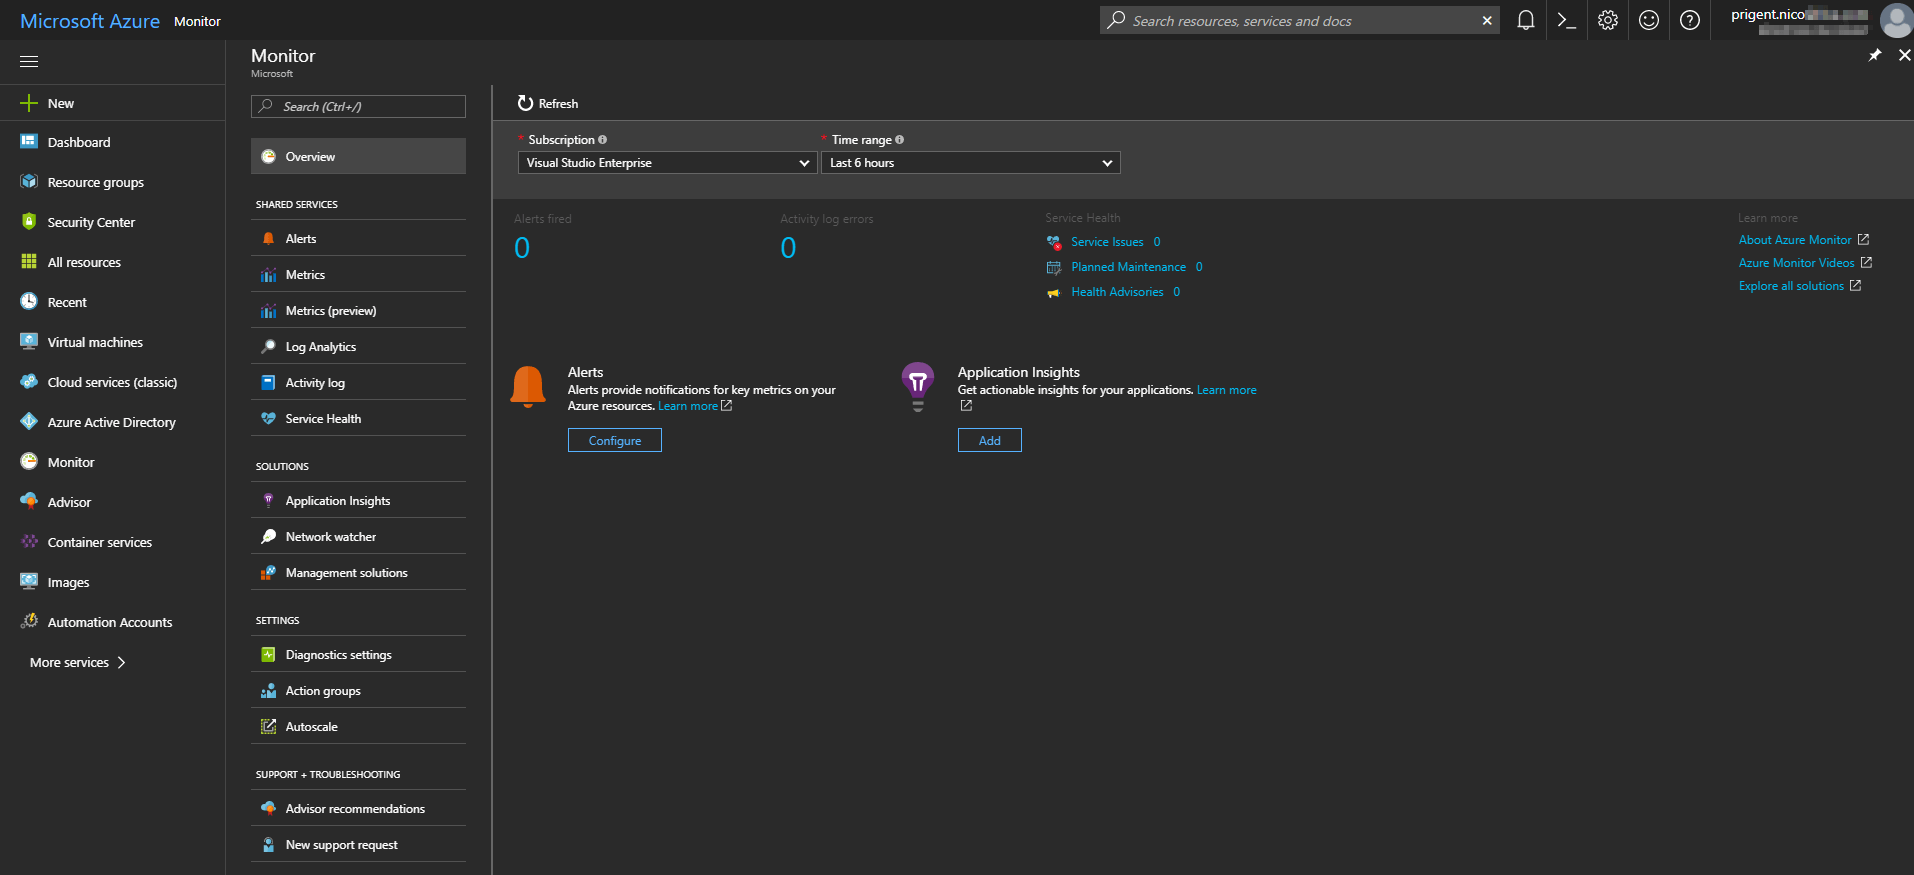
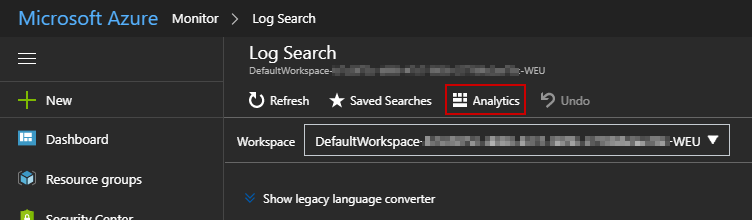
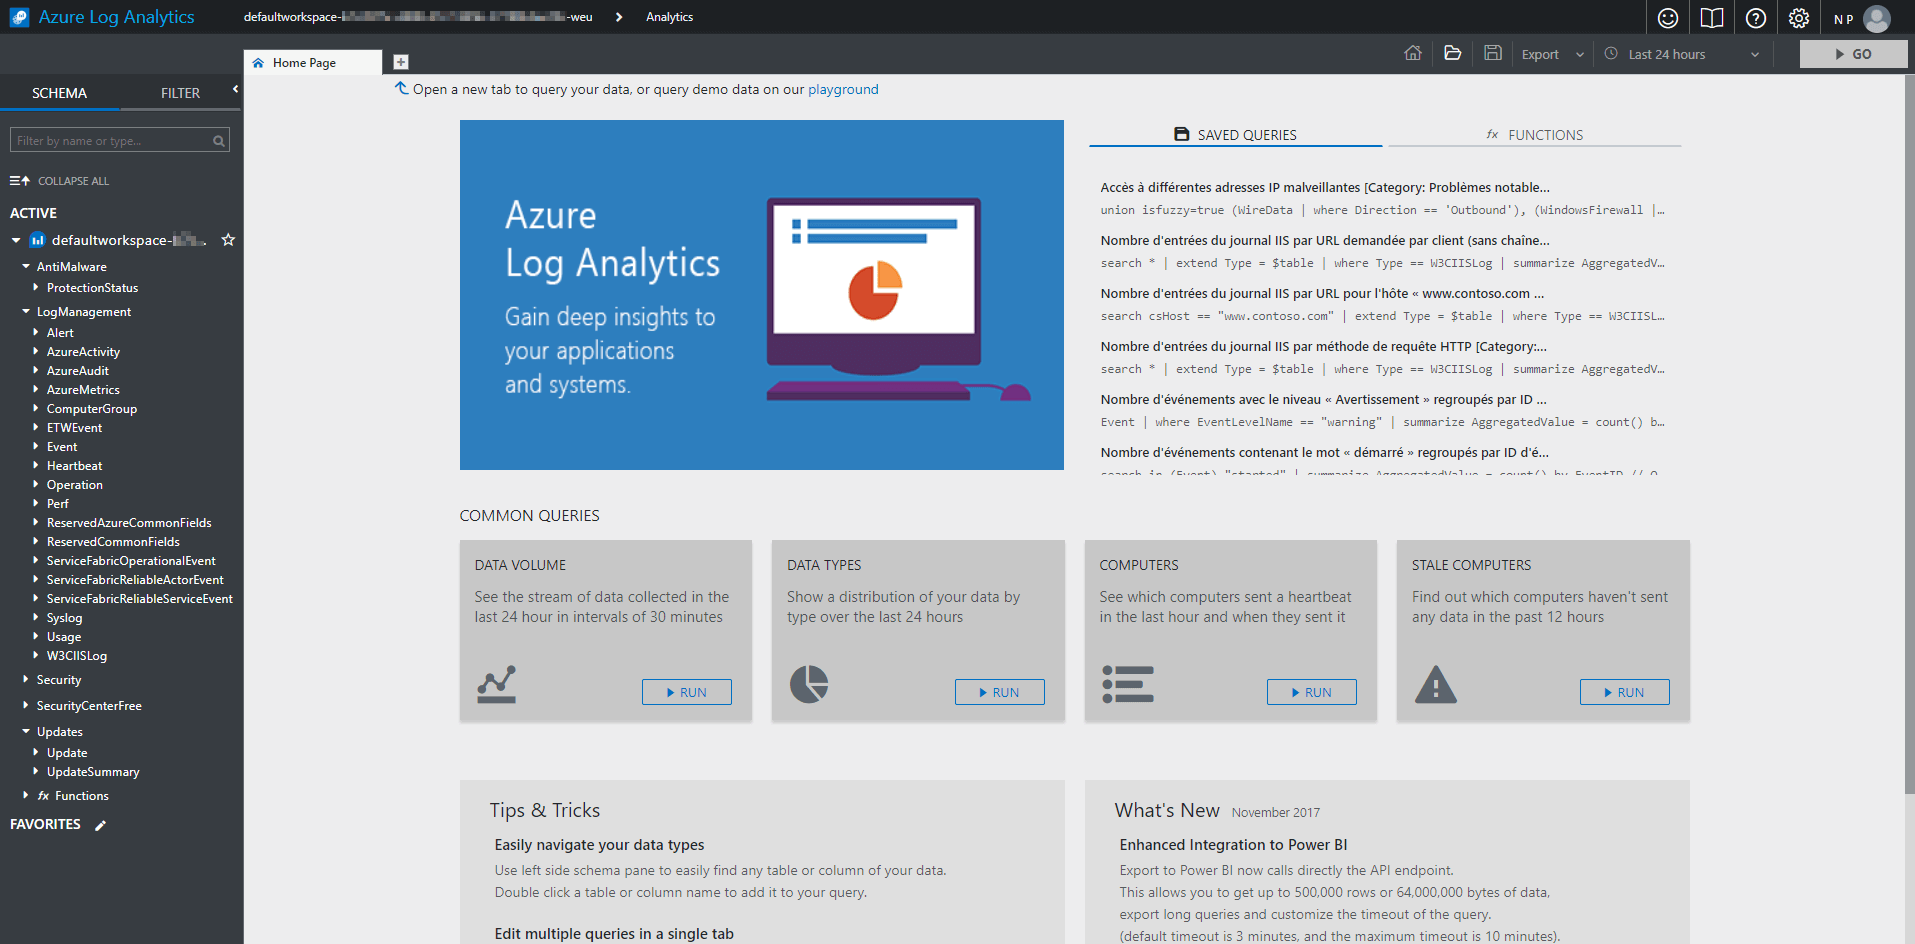
From Azure Monitor, you can also go to Log Analytics (formerly known as OMS Log Analytics). OMS is an Azure service that ingests log and metric data from Azure Monitor and Azure VMs. Then you can easily search logs. OMS provides rich tools to analyze data, run complex queries, and can proactively alert on specified conditions. OMS must be explained in a dedicated article, but if you want to explore OMS, you can click “Analytics”.
Activity Log
Let’s see an important section which is called “Activity Log”. The activity log section describes all operations performed on resources in your Azure subscription. Activity Log events are stored in the platform and available to query for 90 days. By selecting an item, you can get more details about an activity.
Note that Azure Activity logs can be used with Power BI. See the following link to get more information: https://azure.microsoft.com/fr-fr/blog/analyze-azure-audit-logs-in-powerbi-more/
Windows PowerShell can also be used to query your Azure Logs. In general, you can manipulate monitoring data using one of the following methods:
- Azure portal
- PowerShell
- Cross-platform Command Line Interface (CLI)
- REST API
- .NET SDK
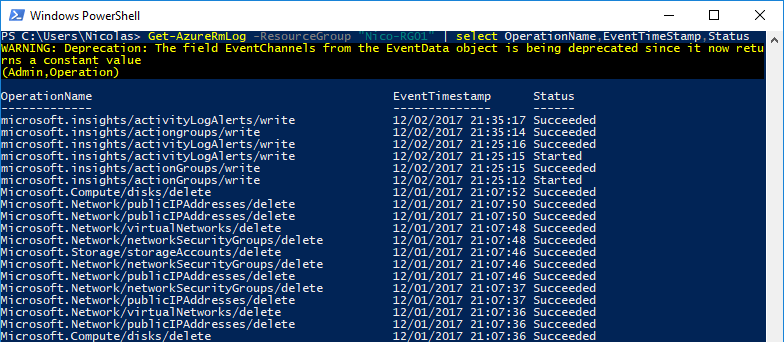
Here, I will use Windows PowerShell to navigate into Azure Logs. Let’s start by running the following command in order to get log entries from a specific Resource Group:
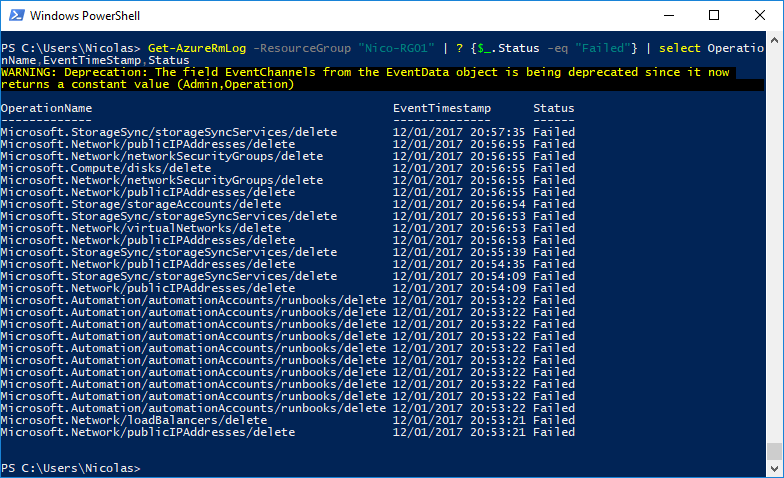
I can filter by Status:
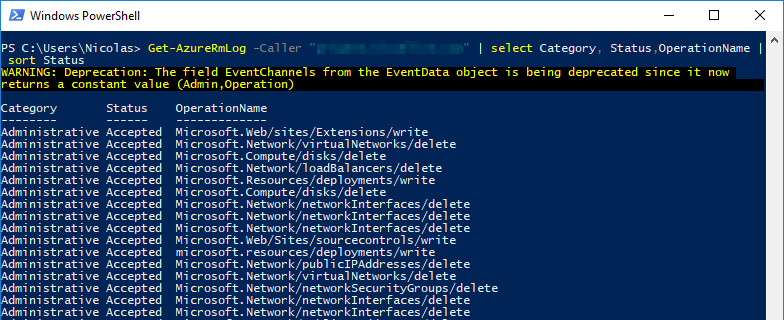
I can also query by caller:
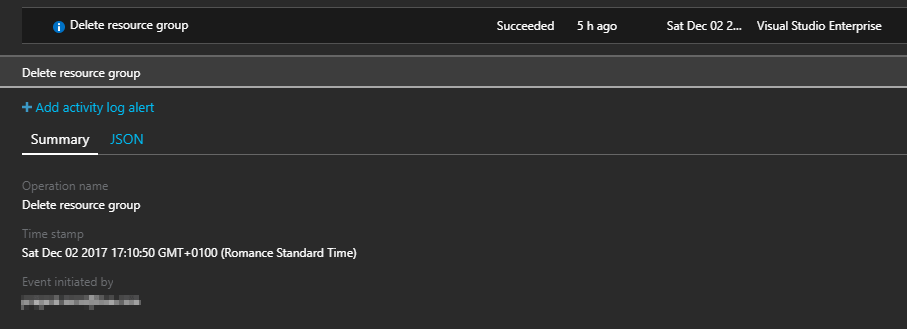
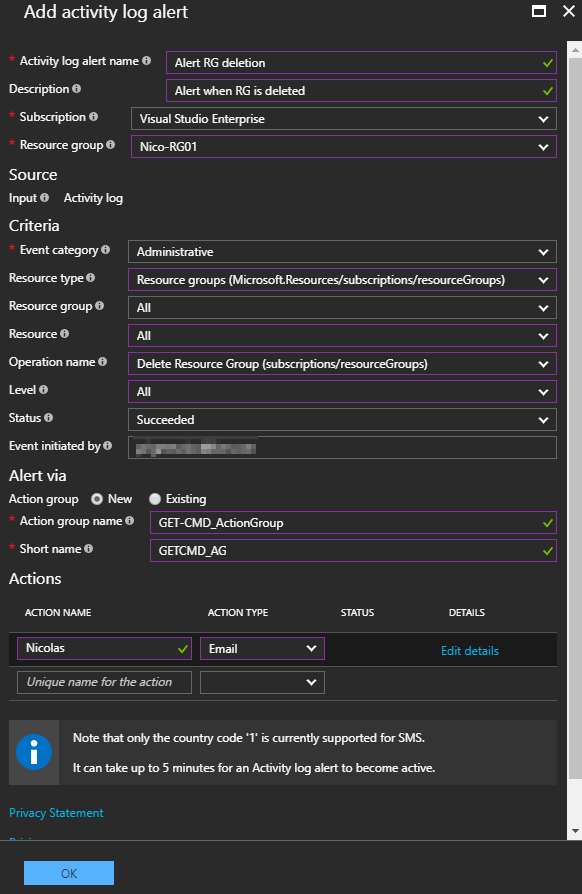
Now, I can configure an activity log alert for an existing action or create an alert from scratch. Here I will use the “Delete Resource Group” action in order to create an alert and be notified by email. Click “Add activity log alert” and enter the required information:
Note that you can also see the following entry once the alert is created:
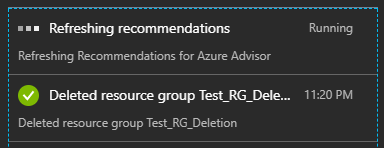
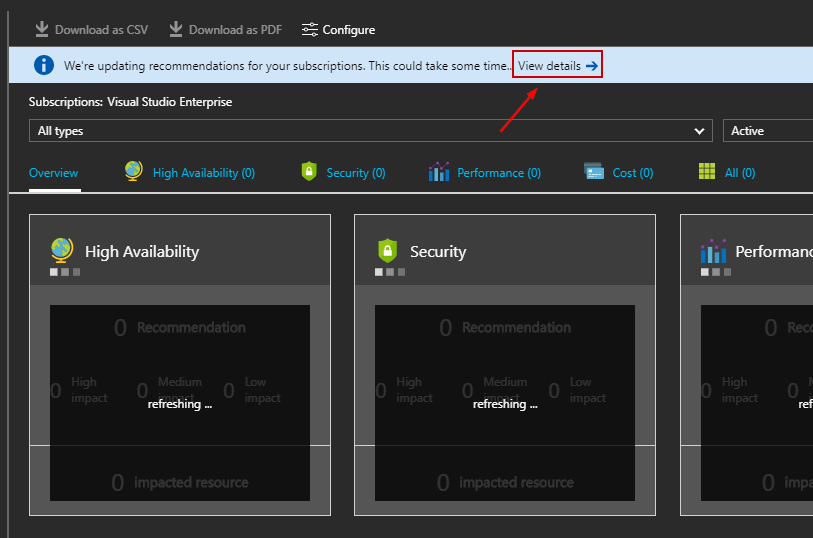
Let’s check if the alert will be successfully generated. I will delete a Resource Group and wait for the notification. Azure will first refreshing recommendations…

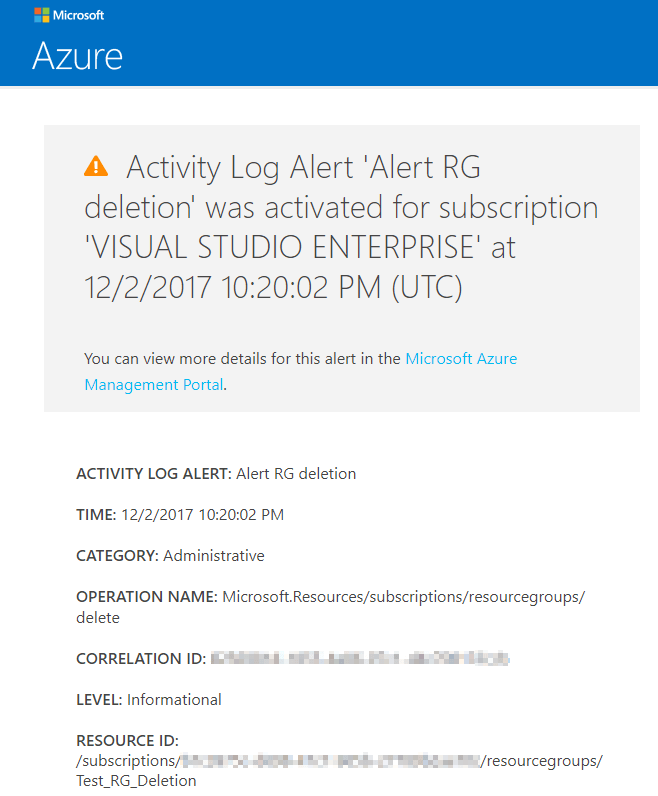
Few seconds later, I received the following notification by email which indicates that a Resource Group has been deleted. The alert is fully functional.
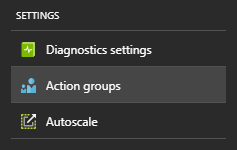
Note that you can simplify this process by creating Action Groups. Action Group contains a list of actions. These groups can be used when you define activity log alerts instead of creating a new action. First, create your Action Group:
Click “Add Action Group” and add the following information:
- Enter an Action Group Name
- Add a Short Name
- Select your Azure Subscription
- Select an existing Resource Group or create a new one
- And finally, add one or more action you want to perform. Here I add an email action type
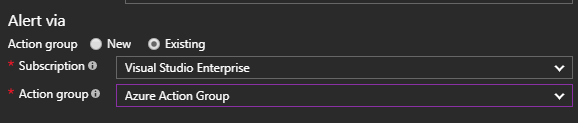
Then, I can select this Action Group when creating an Activity Log Alert:
Azure Advisor
Here is another interesting service which is called “Advisor”. Azure Advisor recommendations helps you to improve the speed and responsiveness of your business-critical applications. It periodically analyzes the security state of your Azure resources and creates recommendations. Before getting recommendations from Advisor, Azure must update your subscriptions.
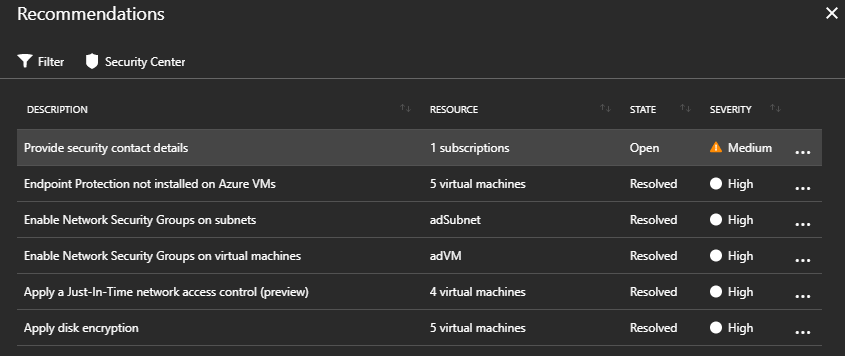
The Security Center will display a list of recommendations that you can dismiss or try to resolve. If it is automatically resolved, the state will be updated to “Resolved”. Recommendations can be very basics such as providing a security contact in your Azure subscription. Advisor also provides recommendations for virtual machines, availability sets, application gateways, App Services, SQL servers, SQL databases, and Redis Cache.
Note that Advisor can be configured to only generate recommendations for specified subscriptions and resource groups.
Azure Metrics
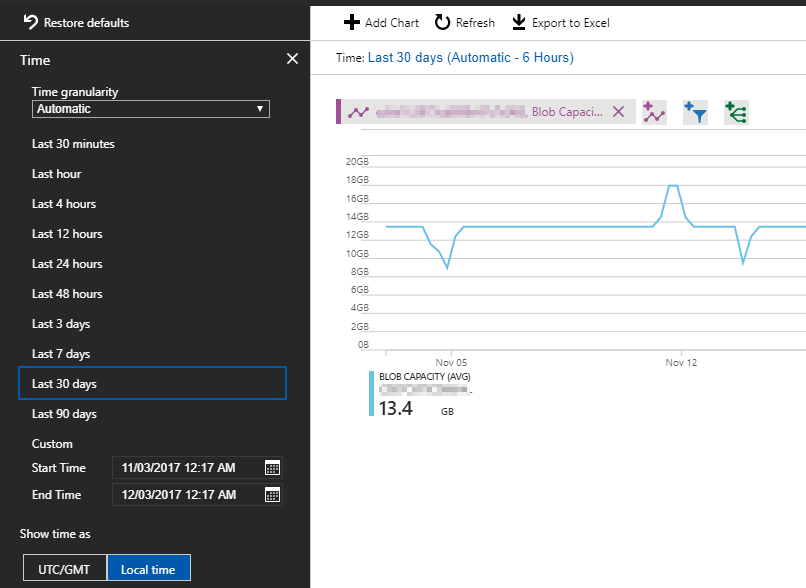
Finally, the latest service to describe in this article is called Azure Metrics which is actually in a public preview. Azure Metrics offers a great Metrics Explorer that allows you to build chart very simple. Navigate to the new Monitor tab, and then select Metrics (preview). The first thing is to select a Resource from the list. Depending the Resource, a sub service must be selected. For example, I choose my Azure Storage Account followed by the subservice “Blob Capacity”. Next, Azure will build a nice chart. I can also adjust the time frame:
Some useful options can be used such as:
- Export to Excel
- Pin to Dashboard
- Clone the Chart
- …
Azure Application Insights
Finally, I highly recommend to watch this video if you want to monitor your Web App. Application Insights can be used to monitor Web Apps: https://channel9.msdn.com/Events/Connect/2016/100
Application Insights is an intelligent, application performance-management service. You can send telemetry about Web App activities to the Application Insights service. There, metric charts and search tools can be used to help troubleshoot issues.
Useful links
Below are some useful links that can help you to start with Azure Monitor:
- Azure Monitor Pricing: https://azure.microsoft.com/en-us/pricing/details/monitor/
- Azure Monitor Announcement: https://azure.microsoft.com/en-us/blog/announcing-the-general-availability-of-azure-monitor/
- Azure Monitor Roadmap: https://azure.microsoft.com/en-us/roadmap/?query=azure+monitor/
- Azure Monitor from Channel9: https://channel9.msdn.com/Blogs/Azure-Monitoring/Get-Started-with-Azure-Monitor
Conclusion
Azure Monitor has to become an important part of your Azure environment. This feature is helpful in order to monitor your Resources and troubleshoot issues. Thanks to Azure Monitor, you can be notified when something goes wrong and take intelligent actions promptly.
Based on customer feedbacks, Microsoft is still enriching telemetry by adding more metrics and logs.
Experience modern data protection with this latest Vembu BDR Suite v.3.8.0 FREE edition. Try the 30 days free trial here: https://www.bdrsuite.com/vembu-bdr-suite-download/
Follow our Twitter and Facebook feeds for new releases, updates, insightful posts and more.