
I happen to get my hands on one of the VSAN pod in our lab and wanted to check how much does Read Cache ratio configuration impacts the workload. Hence I planned a simple scenario to test out the impact of Read Cache Ratio. This post shares the findings I had.
I had a moderate setup with 4 node Hybrid VSAN cluster running on Dell PowerEdge C6220 II servers with 16 CPU cores and 192 GB RAM. Each server contains 1 x 400GB SSD drive and 3 x 1 TB SAS drives.
To test out my scenario, firstly I created two Storage Policies.
The only difference in the Rule Sets of the 2 policies is the Read Cache Ratio. See screenshot below.
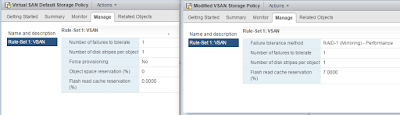

The 1st Storage Policy has “Flash Read Cache reservation” as “NIL”, whereas the 2nd Storage Policy has “Flash Read Cache reservation” as “7%”
I then created 2 VMs (“VSAN-Win-Test” & “VSAN-Win-Test2”) running Windows 7 x64 bit OS, each mapped to one of the above Storage Policy respectively.
Next I installed IO-meter in both the VMs to pump dummy load on VSAN.
Note: Load was produced on both the VMs at different time intervals to get isolated results.
Since I didn’t have heavy disk duty disks in my VSAN lab, I planned to simulate a VDI like workload pattern using IO-meter
The Workload profile was : 2 Workers, 4 KB block size, 70:30 – Read/Write Ratio with Sequential IOs.
Let me share the findings of each test one at a time:
Test 1 :
VM Name: VSAN-Win-Test
Storage Profile: Virtual SAN Default Storage Policy
Time Interval: 3:00 PM to 4:30 PM
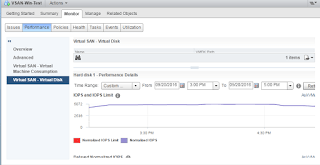
This above Images represents the Total IOPS produced by this VM (with IO-meter pumping the load) in the measured time interval.
Result 1:
With no Cache Reservation and with a moderate IO profile and disk configuration (described above), I was able to achieve a roughly 5000 IOPS consistently.
Test 2 :
VM Name: VSAN-Win-Test2
Storage Profile: Modified VSAN Storage Policy
Time Interval: 6:00 PM to 7:00 PM
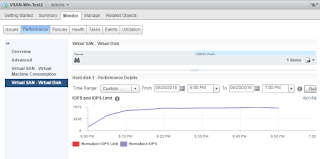
This image represents the Total IOPS produced by this VM (with IO-meter pumping the load) in the measured time interval.
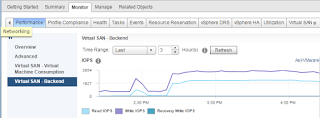
Now the observation on VSAN Backend IOPS graph in Test 2 is quite interesting.
And to explain it better I would want to put the side by side to the earlier test result.
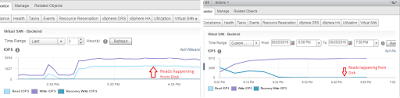
Suggest to click and enlarge the above picture. It’s a comparison of what’s happening at the VSAN disk level in the 2 test results.
In the first LHS image since there is NIL Read Cache reservation – hence there were a lot of Read IOPS which were hitting the Capacity Tier.
However in the RHS image, we configured Storage Policy with 7% Read Cache reservation hence the Read IOPs hitting the Capacity tier over a period of time went down to almost negligible.
That’s because a good amount of Read IOs were catered from the Cache-Tier.
hence the Result 2:-
A whooping increase of 2500 IOPS than the previous results, with the same server/disk config, same VM configuration and same workload pattern.
The earlier result showed a consistent 5000 IOPS delivery, but with just a minor tweak of the Cache reservation value I could achieve a consistent 7500 IOPS without any other change in the setup.
Of course the benefit of Read Cache reservation is subjected to the type of workload running. Hence it becomes all the more important for a consultant to understand what are we sizing for.
Knowing the capacity, IOPS and Latency alone is not just enough. We need to also know the application behavior.
Things like
- What kind of workload is it? Web, App, DB
- What the IO pattern? Is it Read or Write Intensive, Is it Random or Sequential IOs, What’s the regular block size.
These additional inputs can help us design the solution in much better manner.
Experience modern data protection with this latest Vembu BDR Suite v.3.9.0 FREE edition. Try the 30 days free trial here: https://www.bdrsuite.com/vembu-bdr-suite-download/
Follow our Twitter and Facebook feeds for new releases, updates, insightful posts and more.