
Most of the organizations think about monitoring of their resources in the cloud. The Microsoft Azure platform offers a flexible, reliable and affordable solution for running service applications for a wide range of businesses. In this blog, we will discuss Microsoft Azure Virtual Machine monitoring, we can monitor most of the steps described below which can be done directly from the portal. And now we are going to focus on the below-mentioned areas for VM monitoring in Azure and it will help you to monitor the Azure VMs easily.
- Diagnostics and metrics
- Azure service health
- Azure resource health
- Alerts
- Logs
- Advance monitoring
Diagnostics and metrics
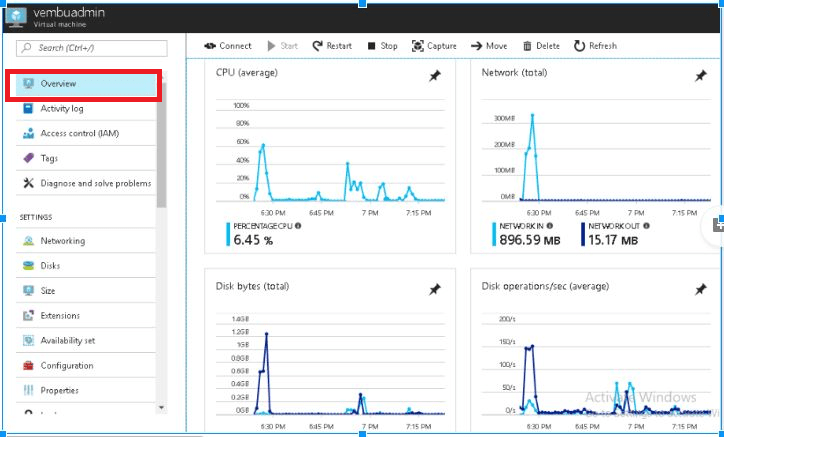
In the Azure portal, We do configure and monitor the collection of diagnostics data using metrics. To monitor Azure VMs basic information like machine CPU usage and network usage details, the total of disk bytes. can be seen by clicking overview tab in the individual virtual machines. It provides you the screen to know all details in a single window.
To View overview tab
Login to Azure portal go to Virtual machines → Click on the VM → and select Overview tab.

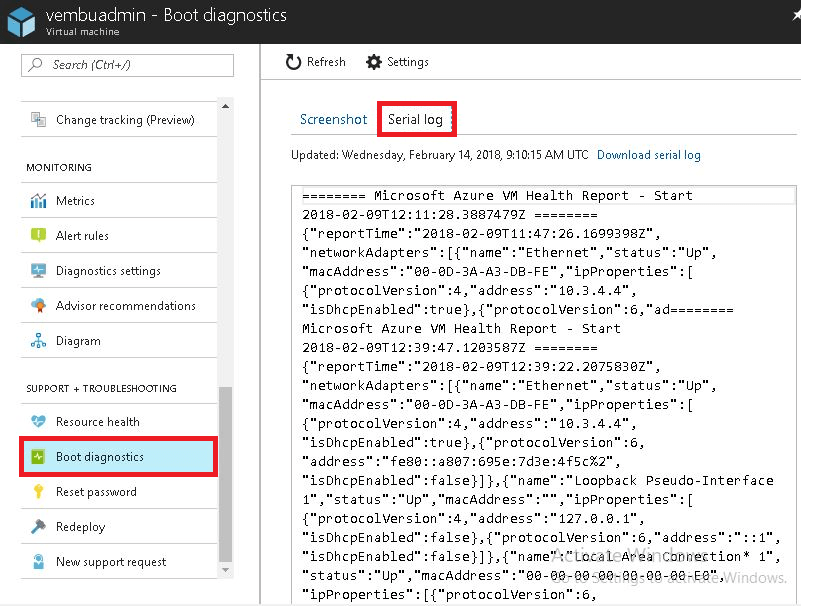
Boot diagnostics feature is one of the useful future in Azure VM monitoring which is used to diagnostic and collect the logs for booting issues of Virtual machines.
If your Azure VM machine is going to non-bootable state, the boot diagnostics logs will help you to identify the booting issue.You can easily enable boot diagnostics when you create a VM by clicking Enabled for Boot Diagnostics under the Monitoring section of the Settings screen.
if you didn’t enable the boot diagnostic option at the time of VM installation later we will enable it from Azure CLI, Azure PowerShell or Azure Resource Manager template.
Check the below links for boot diagnostics using Azure CLI, Azure PowerShell or Azure Resource Manager template.
https://docs.microsoft.com/en-us/azure/virtual-machines/windows/extensions-diagnostics-template
https://docs.microsoft.com/en-gb/cli/azure/vm/boot-diagnostics?view=azure-cli-latest
To check boot diagnostics logs
Login to azure portal go to Virtual machines → Select and Click on the individual VM → Click SUPPORT + TROUBLESHOOTING → Click Boot diagnostics.
Azure Service Health
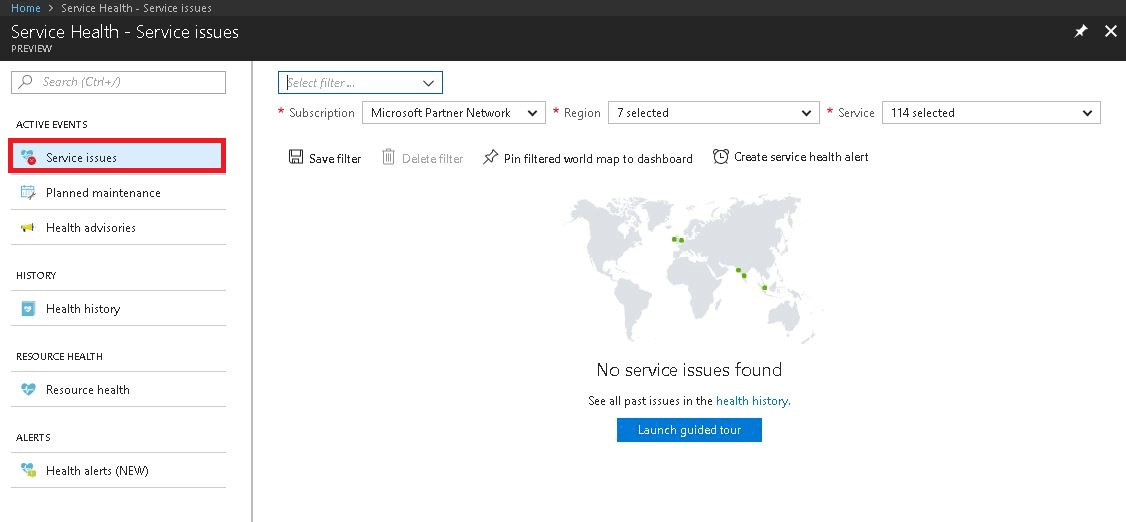
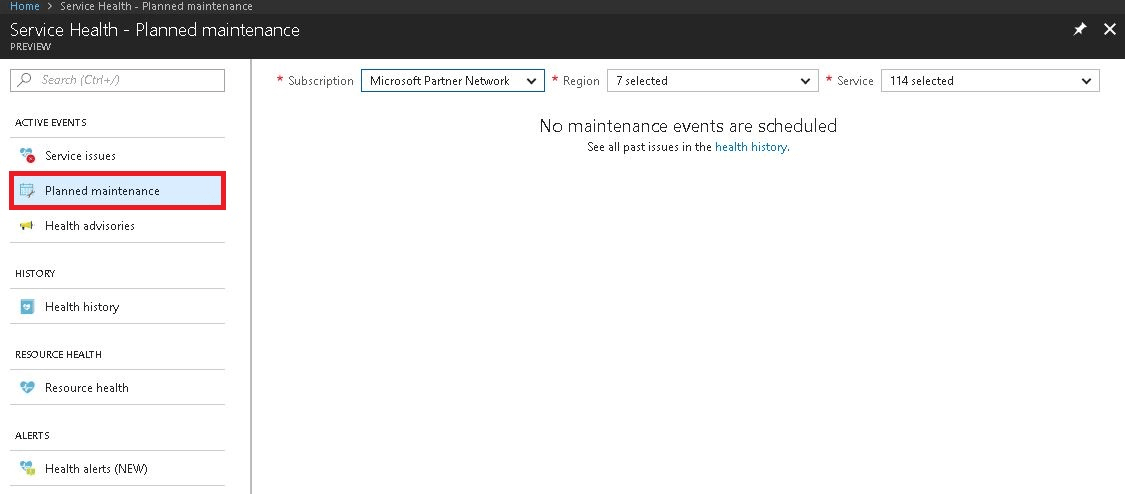
Azure service health is used to check and prepare for upcoming planned and maintenance activities in the Azure cloud. This future will help you to guide and notify if there is any planned activity happening in Azure cloud. When issues arise in Azure services it will affect your business-critical resources, Azure Service Health notifies you and your teams, helps you understand the impacts of the issue and keeps you updated as the issue is resolved.
If you want to check Azure service health Please refer the below snapshots.
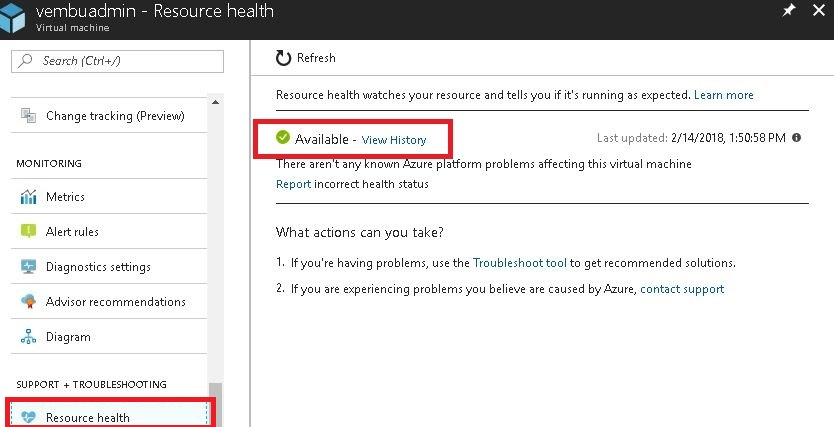
Azure resource Health
Azure resource health service is available within the Azure portal that can help you to identify the resource health status.
- Resource Available: It indicates that there is no issue with the resource, and the resource is available state
- Unavailable: Indicates a problem and unavailability of the resource
- Unknown: Resource health is not able to determine the status of the resource
To check Azure resource health service Please refer the below snapshots.
Alerts
Either something does or does not happen, and you want to be notified to this, Azure alerts will help you to create alerts and manage them in a single place. For example, if your VMs get exceeded with the usage limit, it helps you to create the alerts by using alert rules. Azure Alerts actually spans across multiple areas. You can create Alerts from Azure Activity Logs, or Azure Metrics, or Operations Management Suite, etc.
For more analysis about alerts Please refer the following links.
https://docs.microsoft.com/en-us/azure/monitoring-and-diagnostics/insights-alerts-portal
https://docs.microsoft.com/en-us/azure/monitoring-and-diagnostics/insights-alerts-powershell
Logs
The Azure Activity Log is actually a part of the Azure Monitor service/solution. Activity logs will help you to monitor and diagnostic your VMs issues. And logs data can be access through by using Azure PowerShell, the Azure CLI. Activity Log is different from Diagnostic Logs. Activity Logs provide data about the operations on a resource from the outside(the “control plane”). Diagnostics Logs are emitted by a resource and provide information about the operation of that resource(the “data plane”).
Advanced monitoring
Operations Management Suite (OMS)
Operations Management Suite (OMS) provides monitoring, alerting, and alert remediation capabilities across cloud and on-premises assets. You can install an extension on a Linux VM or a Windows VM that installs the OMS agent, and enrolls the VM into an existing OMS workspace. Operations Management Suite (also known as OMS) is a collection of management services that were designed in the cloud from the start. Rather than deploying and managing on-premises resources, OMS components are entirely hosted in Azure. Configuration is minimal, and you can be up and running literally in a matter of minutes.
Log Analytics
Log Analytics is a service in OMS that monitors your cloud and on-premises environments to maintain their availability and performance. It collects data generated by resources in your cloud and on-premises environments and from other monitoring tools to provide analysis across multiple sources.
Network Watcher
Network Watcher enables you to monitor your VM and its associated resources as they relate to the network that they are in. This service includes packet capture, next hop, IP flow verify, security group view, NSG flow logs. Scenario level monitoring provides an end to end view of network resources in contrast to individual network resource monitoring.You can install the Network Watcher Agent extension on a Linux VM or a Windows VM.
Conclusion
Microsoft Azure provides you to monitor the performance of your virtual machines and its help you to troubleshoot and resolve the problems before and after users affected. This blog guides you with additional information to monitor the Azure Virtual Machines with the different types of Azure Monitoring tools.
To know more about VM Monitoring please visit the below links for Windows Virtual Machine with Azure PowerShell or Monitor a Linux Virtual Machine with the Azure CLI.
https://docs.microsoft.com/en-us/azure/virtual-machines/windows/tutorial-monitoring
https://docs.microsoft.com/en-us/azure/virtual-machines/linux/tutorial-monitoring
https://docs.microsoft.com/en-gb/azure/architecture/best-practices/monitoring
Experience modern data protection with this latest Vembu BDR Suite v.3.9.0 FREE edition. Try the 30 days free trial here: https://www.bdrsuite.com/vembu-bdr-suite-download/
Got questions? Email us at: vembu-support@vembu.com for answers.
Follow our Twitter and Facebook feeds for new releases, updates, insightful posts and more.